 Portfolio Optimization 5.0
The Portfolio Optimization template optimizes capital weightings for portfolios of financial investments that maximizes return and minimizes risk. Technical analysis constant parameters are optimized to maximize back tested returns on signal trading.
Last update
20 Apr. 2015
| old versions
Licence
Free to try |
$26.00
OS Support
Windows Me
Downloads
Total: 2,864 | Last week: 0
Ranking
#1124 in
Accounting & Billing Software
Publisher
Business Spreadsheets
Screenshots of Portfolio Optimization
Portfolio Optimization Publisher's Description
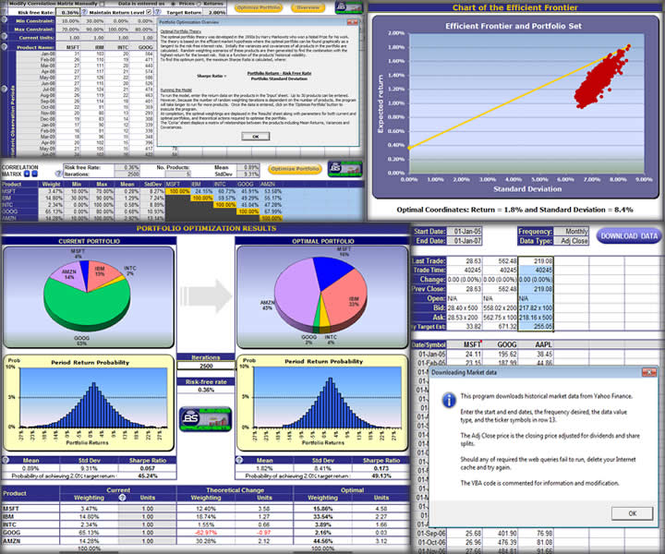
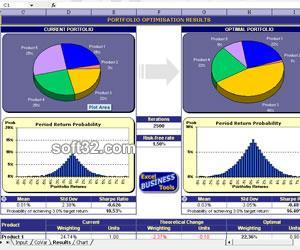
The Portfolio Optimization template identifies the optimal capital weightings for a portfolio of financial investments that gives the desired risk and return profile based on the correlation between individual investments. The design of the portfolio optimization model enables it to be applied to either financial instrument or business stream portfolios with long and short positions. The portfolio optimization template is intuitive and flexible with help icons throughout to assist with input and interpretation of output results. Input of historical data for the analysis is supported by options to specify absolute prices or returns, number of current units held and a tool to download long time periods of financial market data for securities from the internet. Advanced optimization options include setting minimum and maximum constraints for weightings in the optimal portfolio and risk analysis options for overall volatility under the Sharpe ratio, downside risk or semi-deviation under the Sortino ratio and gain/loss under the Omega ratio. Optimization can be set to maintain at least the current level of return and specify a target return for which the probability of attaining is calculated via Monte Carlo simulation. The portfolio optimization results are displayed with weighting charts and return distributions as well as acquisition and liquidation actions required. Technical analysis is provided with back tested total return from signal trading and automatic optimization of technical period constants for each investment or the total portfolio that results in the highest back tested return. Technical analysis indicators with detailed charting and back testing analysis include simple moving average (SMA), rate of change (ROC), moving average convergence/divergence (MACD), relative strength index (RSI) and Bollinger Bands. The template is compatible with Excel 97-2013 for Windows and Excel 2011 or 2004 for Mac as a cross platform portfolio optimization solution.
Look for Similar Items by Category
Feedback
- If you need help or have a question, contact us
- Would you like to update this product info?
- Is there any feedback you would like to provide? Click here
Popular Downloads
-
 Kundli
4.5
Kundli
4.5
-
 Grand Auto Adventure
1.0
Grand Auto Adventure
1.0
-
 Macromedia Flash 8
8.0
Macromedia Flash 8
8.0
-
 Grand Theft Auto: Vice City
1.0
Grand Theft Auto: Vice City
1.0
-
 Cool Edit Pro
2.1.3097.0
Cool Edit Pro
2.1.3097.0
-
 Hill Climb Racing
1.0
Hill Climb Racing
1.0
-
 Cheat Engine
6.8.1
Cheat Engine
6.8.1
-
 Zuma Deluxe
1.0
Zuma Deluxe
1.0
-
 Tom VPN
2.2.8
Tom VPN
2.2.8
-
 Horizon
2.9.0.0
Horizon
2.9.0.0
-
 Vector on PC
1.0
Vector on PC
1.0
-
 Netcut
2.1.4
Netcut
2.1.4
-
 Minecraft
1.10.2
Minecraft
1.10.2
-
 Grand Theft Auto IV Patch...
1.0.1.0
Grand Theft Auto IV Patch...
1.0.1.0
-
 Microsoft Office 2010
Service...
Microsoft Office 2010
Service...
- CDMA2000 1X Wireless Network... 1.0.0.26
-
 Operation Ubersoldat
1.0
Operation Ubersoldat
1.0
-
 Ulead Video Studio Plus
11
Ulead Video Studio Plus
11
-
 C-Free
5.0
C-Free
5.0
-
 Windows XP Service Pack 3
Build...
Windows XP Service Pack 3
Build...